Independent product testing

Electrolyte test results

Explore the results

We bought 14 electrolyte products from retail stores and sent them for independent laboratory testing.

Choose a product to compare the amounts on its label with the lab measurements for sodium, magnesium and potassium.

How to read the charts: 100% matches the label claim. Na = sodium, Mg = magnesium and K = potassium.

Last Updated-02/10/2026

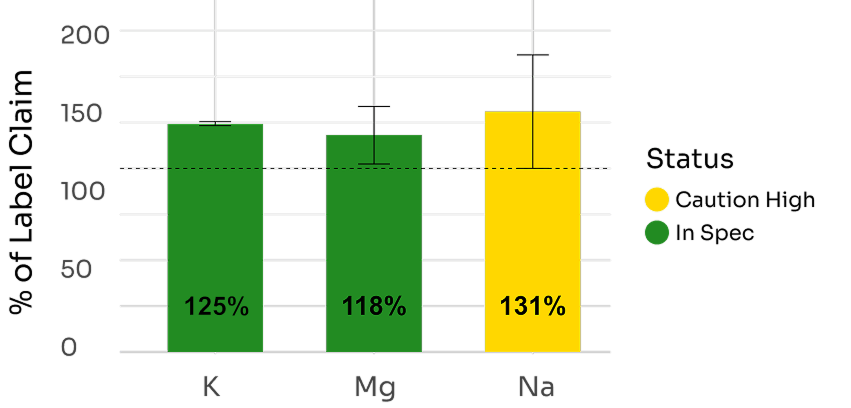
Ultima Electrolytes

All three minerals tested above the label claim. The original report flags sodium as caution high.
Lab measurements vs. label claims
Original laboratory comparison chart for Ultima ElectrolytesEnlarge chart ↗

100% = matches the label
K = potassium · Mg = magnesium · Na = sodium

What do the colors and error bars mean?

The colors carry the original report’s labels, such as “In Spec” and “Caution High.” The source report does not specify the numerical thresholds or how its error bars were calculated. These labels are not a separate safety rating. The chart is reproduced as published; its statistical basis is not specified in the accompanying text. The table shows each laboratory separately.

View both laboratories’ measurements

Laboratory results

Amounts per reported serving. Scroll for all columns ↔
Brand Labs Serving Size (g) Na (mg/serv) Mg (mg/serv) K (mg/serv) K % of Claim Mg % of Claim Na % of Claim Label Na Label Mg Label K
Brand: Ultima (Lot# No: 0092B4B) Serving Size: 3.7 g
Ultima (Lot# No: 0092B4B) Omnient Labs 3.7 84 129 313 125% 129% 153% 55 100 250
NJ Labs 3.7 60 107 309 124% 107% 109% 55 100 250
Avg (Labs) 3.7 72 118 311 125% 118% 131% 55 100 250
Read the detailed findings

Third-party lab results confirm that Ultima delivers more electrolytes per serving than listed, with potassium at 124%, magnesium at 118%, and sodium at 131% of the label claim. While potassium and magnesium fall within acceptable ranges, sodium exceeds the expected amount and is flagged for caution.
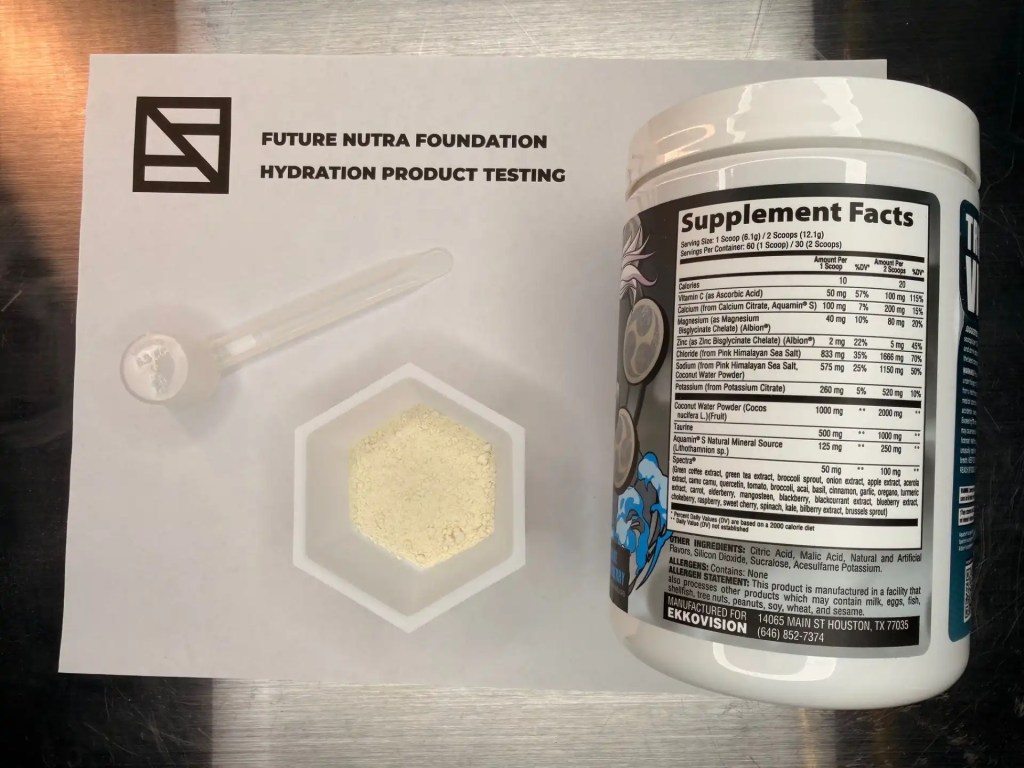
Ekkolyte (2 Scoops) Electrolytes

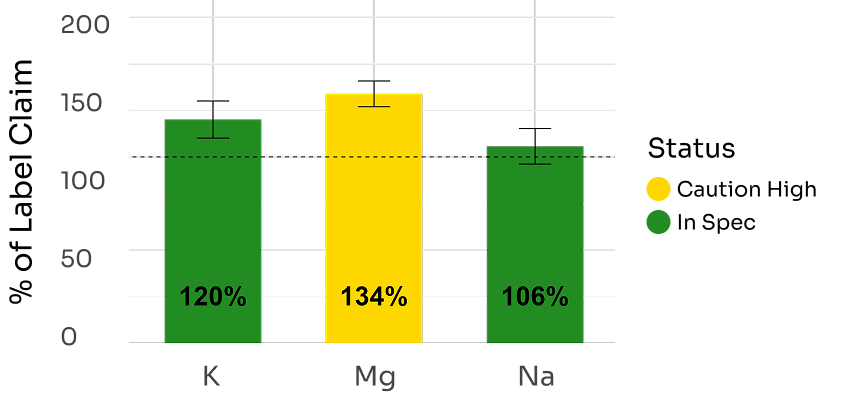
Testing used a two-scoop serving. The original report flags magnesium as caution high.

Lab measurements vs. label claims
Original laboratory comparison chart for Ekkolyte (2 Scoops) ElectrolytesEnlarge chart ↗

100% = matches the label
K = potassium · Mg = magnesium · Na = sodium

What do the colors and error bars mean?

The colors carry the original report’s labels, such as “In Spec” and “Caution High.” The source report does not specify the numerical thresholds or how its error bars were calculated. These labels are not a separate safety rating. The chart is reproduced as published; its statistical basis is not specified in the accompanying text. The table shows each laboratory separately.

View both laboratories’ measurements

Laboratory results

Amounts per reported serving. Scroll for all columns ↔
Brand Labs Serving Size (g) Na (mg/serv) Mg (mg/serv) K (mg/serv) K % of Claim Mg % of Claim Na % of Claim Label Na Label Mg Label K
Brand: Ekkolyte (2 scoop) (Lot# No: 2409307) Serving Size: 12.1 g
Ekkolyte (2 scoop) (Lot# No: 2409307) Omnient Labs  12.1 1138 103 588 113% 129% 99% 1150 80 520
NJ Labs  12.1 1293 111 661 127% 139% 112% 1150 80 520
Avg (Labs)  12.1 1215 107 624 120% 134% 106% 1150 80 520
Read the detailed findings

Independent testing shows that Ekkolyte’s electrolyte levels exceed the stated label claims. Potassium and sodium remain within acceptable ranges at 120% and 106%, while magnesium is significantly higher at 134% and marked as caution high. Results confirm that the formula delivers more electrolytes per serving than advertised.

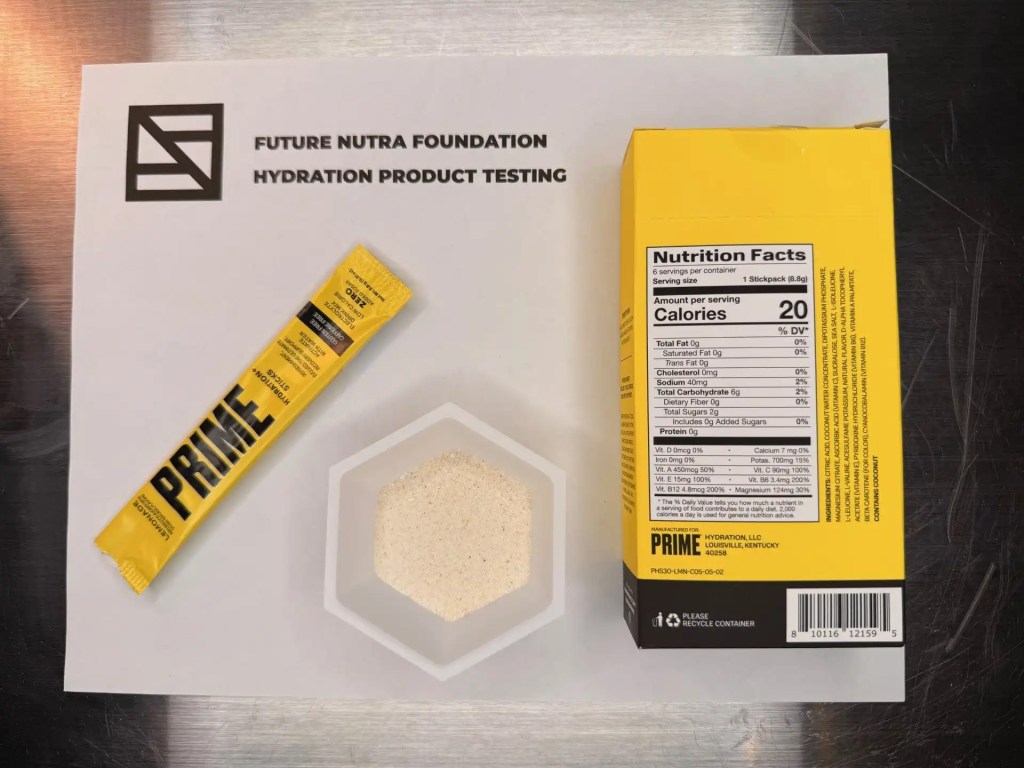
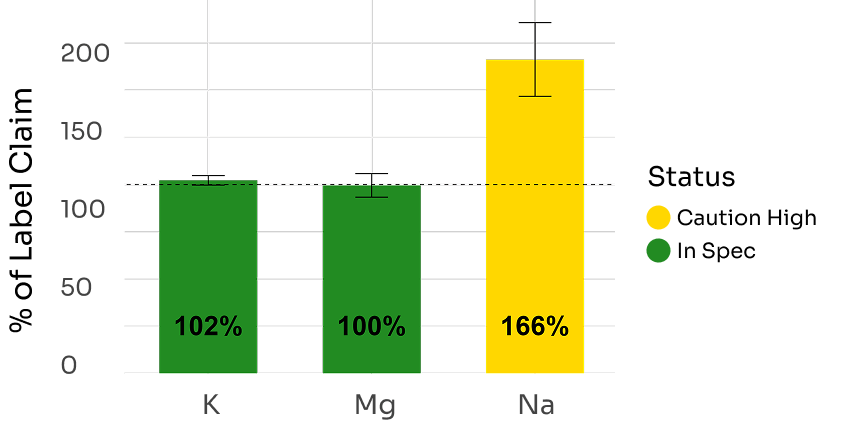
Prime Electrolytes

Both labs measured more sodium and potassium than the label lists. Magnesium stayed close to the label claim.

Lab measurements vs. label claims
Original laboratory comparison chart for Prime ElectrolytesEnlarge chart ↗

100% = matches the label
K = potassium · Mg = magnesium · Na = sodium

What do the colors and error bars mean?

The colors carry the original report’s labels, such as “In Spec” and “Caution High.” The source report does not specify the numerical thresholds or how its error bars were calculated. These labels are not a separate safety rating. The chart is reproduced as published; its statistical basis is not specified in the accompanying text. The table shows each laboratory separately.

View both laboratories’ measurements

Laboratory results

Amounts per reported serving. Scroll for all columns ↔
Brand Labs Serving Size (g) Na (mg/serv) Mg (mg/serv) K (mg/serv) K % of Claim Mg % of Claim Na % of Claim Label Na Label Mg Label K
Brand: Prime (Lot# No: A209960923) Serving Size: 8.8 g
Prime (Lot# No: A209960923) Omnient Labs 8.8 61 129 703 100.% 104% 152% 40 124 700
NJ Labs 8.8 72 118 728 104% 95% 180% 40 124 700
Avg (Labs) 8.8 66 123 716 102% 100% 166% 40 124 700
Read the detailed findings

Both third-party labs confirmed that Prime contains more sodium and potassium than listed on the label, while magnesium stays near the expected amount. One batch showed sodium levels nearly 80% higher than claimed.

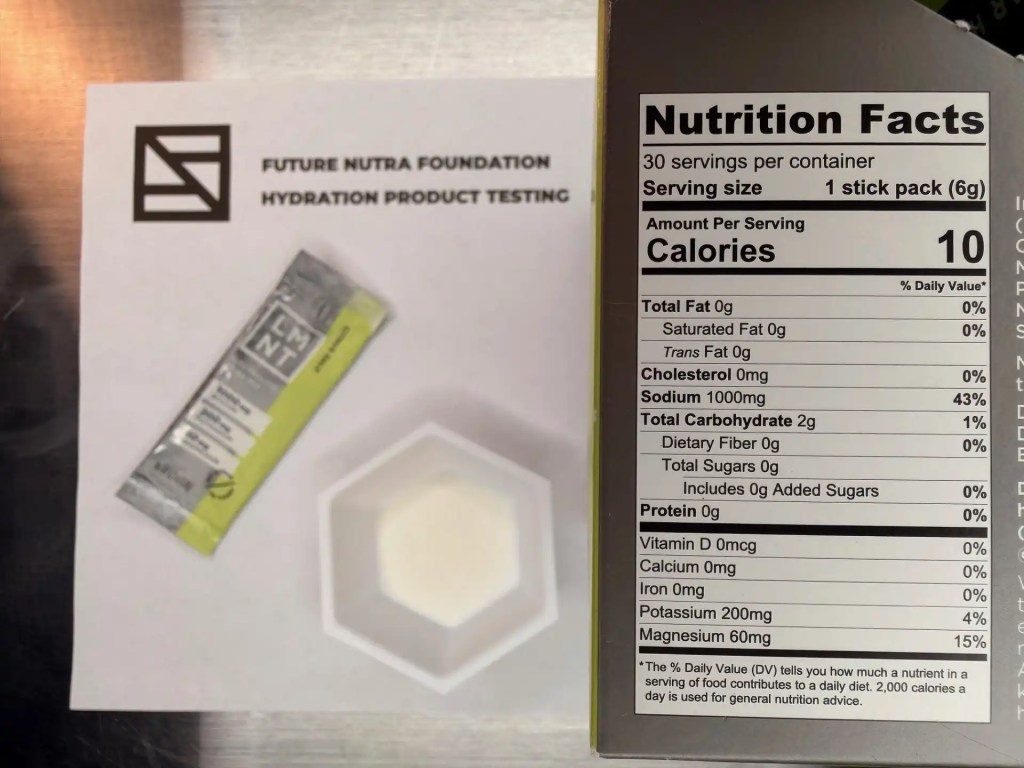
LMNT Electrolytes

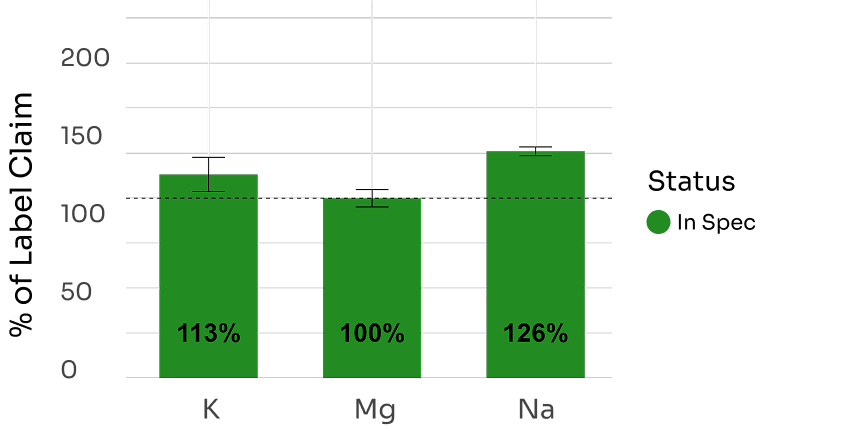
Measured amounts closely matched or exceeded the label claims for all three minerals.

Lab measurements vs. label claims
Original laboratory comparison chart for LMNT ElectrolytesEnlarge chart ↗

100% = matches the label
K = potassium · Mg = magnesium · Na = sodium

What do the colors and error bars mean?

The colors carry the original report’s labels, such as “In Spec” and “Caution High.” The source report does not specify the numerical thresholds or how its error bars were calculated. These labels are not a separate safety rating. The chart is reproduced as published; its statistical basis is not specified in the accompanying text. The table shows each laboratory separately.

View both laboratories’ measurements

Laboratory results

Amounts per reported serving. Scroll for all columns ↔
BrandLabsServing Size (g)Na (mg/serv)Mg (mg/serv)K (mg/serv)K % of ClaimMg % of ClaimNa % of ClaimLabel NaLabel MgLabel K
Brand: LMNT
(Lot# No:
1632401W)
Serving Size: 6 g
LMNT
(Lot# No:
1632401W)
Omnient Labs 6127758240110%97%128%100060200
NJ Labs 6124362213106%103%124%100060200
Avg (Labs) 6126060226113%100%126%100060200
Read the detailed findings

Independent lab testing shows LMNT electrolytes closely match or exceed their label claims for sodium, magnesium, and potassium. Results confirm the product is in spec, with especially strong accuracy for magnesium and elevated levels of sodium and potassium compared to stated values.

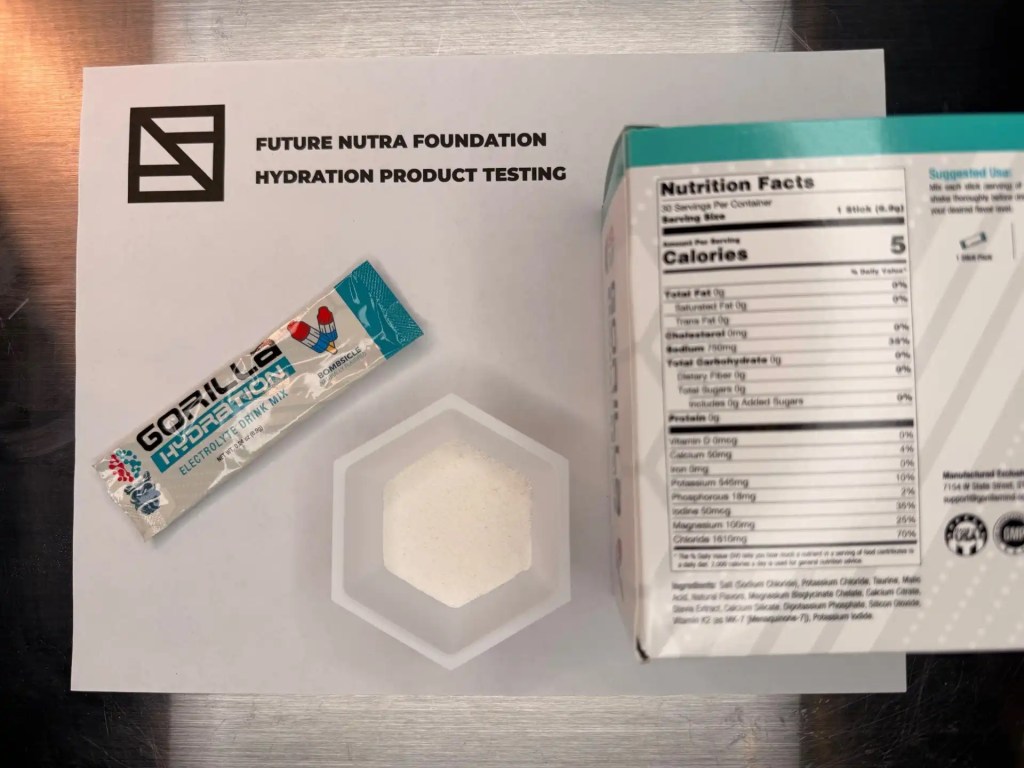
Gorilla Mind Electrolytes

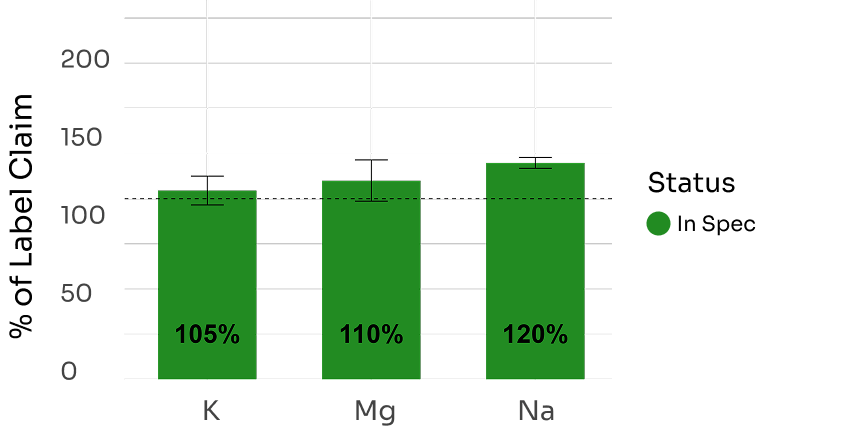
Sodium and magnesium tested above the label claim in both labs. Potassium results varied slightly between labs.

Lab measurements vs. label claims
Original laboratory comparison chart for Gorilla Mind ElectrolytesEnlarge chart ↗

100% = matches the label
K = potassium · Mg = magnesium · Na = sodium

What do the colors and error bars mean?

The colors carry the original report’s labels, such as “In Spec” and “Caution High.” The source report does not specify the numerical thresholds or how its error bars were calculated. These labels are not a separate safety rating. The chart is reproduced as published; its statistical basis is not specified in the accompanying text. The table shows each laboratory separately.

View both laboratories’ measurements

Laboratory results

Amounts per reported serving. Scroll for all columns ↔
Brand Labs Serving Size (g) Na (mg/serv) Mg (mg/serv) K (mg/serv) K % of Claim Mg % of Claim Na % of Claim Label Na Label Mg Label K
Brand: Gorilla (Lot# No: 1519924) Serving Size: 6.9 g
Gorilla (Lot# No: 1519924) Omnient Labs  6.9 915 118 601 110% 118% 122% 750 100 545
NJ Labs  6.9 883 102 539 99% 102% 118% 750 100 545
Avg (Labs)  6.9 899 110 570 105% 110% 120% 750 100 545
Read the detailed findings

Independent testing from Omnient Labs and NJ Labs shows Gorilla Mind meets or exceeds label claims across all measured electrolytes. Sodium results exceeded the label claim in both labs, with Omnient Labs reporting 122% and NJ Labs reporting 118%, averaging 120%. Magnesium also performed above the label claim, with results of 118% from Omnient Labs and 102% from NJ Labs, averaging 110%. Potassium results showed slight variability, with Omnient Labs reporting 110% and NJ Labs reporting 99%, averaging 105%. Overall, Gorilla Mind remains well within specification across all tested electrolytes.

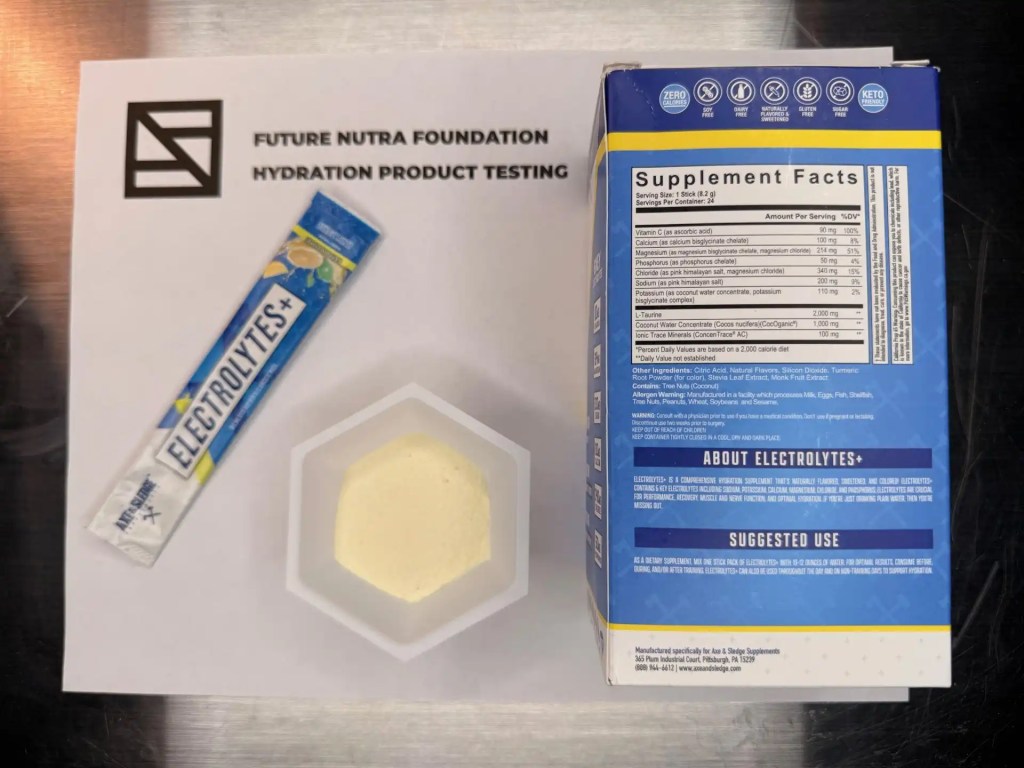
Axe & Sledge Electrolytes

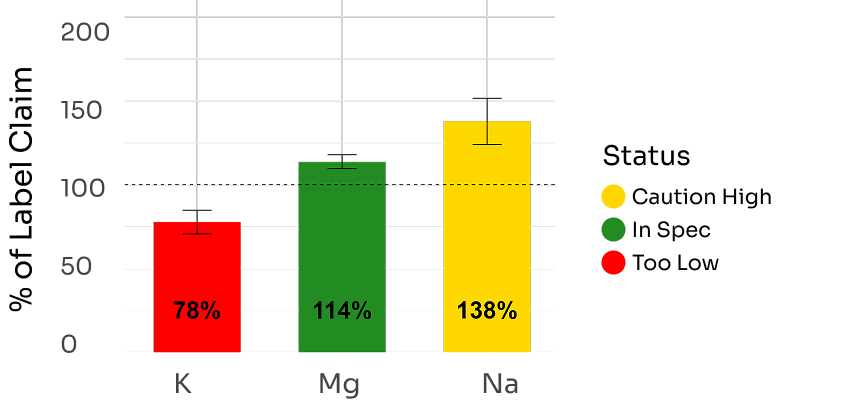
Potassium tested below the label claim and was marked “Too Low” in the original report.

Lab measurements vs. label claims
Original laboratory comparison chart for Axe & Sledge ElectrolytesEnlarge chart ↗

100% = matches the label
K = potassium · Mg = magnesium · Na = sodium

What do the colors and error bars mean?

The colors carry the original report’s labels, such as “In Spec” and “Caution High.” The source report does not specify the numerical thresholds or how its error bars were calculated. These labels are not a separate safety rating. The chart is reproduced as published; its statistical basis is not specified in the accompanying text. The table shows each laboratory separately.

View both laboratories’ measurements

Laboratory results

Amounts per reported serving. Scroll for all columns ↔
Brand Labs Serving Size (g) Na (mg/serv) Mg (mg/serv) K (mg/serv) K % of Claim Mg % of Claim Na % of Claim Label Na Label Mg Label K
Brand: Axe&Sledge (Lot# No: 21829-2) Serving Size: 8.27 g
Axe&Sledge (Lot# No: 21829-2) Omnient Labs  8.2 256 250 91 83% 117% 128% 200 214 110
NJ Labs  8.2 295 237 80 73% 111% 147% 200 214 110
Avg (Labs)  8.2 275 244 86 78% 114% 138% 200 214 110
Read the detailed findings

Axe & Sledge’s lab results show a significant deviation from the label claim for potassium, with levels at only 78% of the claimed value, marked as “Too Low”. Sodium and magnesium are within the expected range, with sodium exceeding the label claim at 127.96%, while magnesium is at 116.60%. The product is in spec for magnesium and sodium, but potassium is below the expected levels according to lab testing.

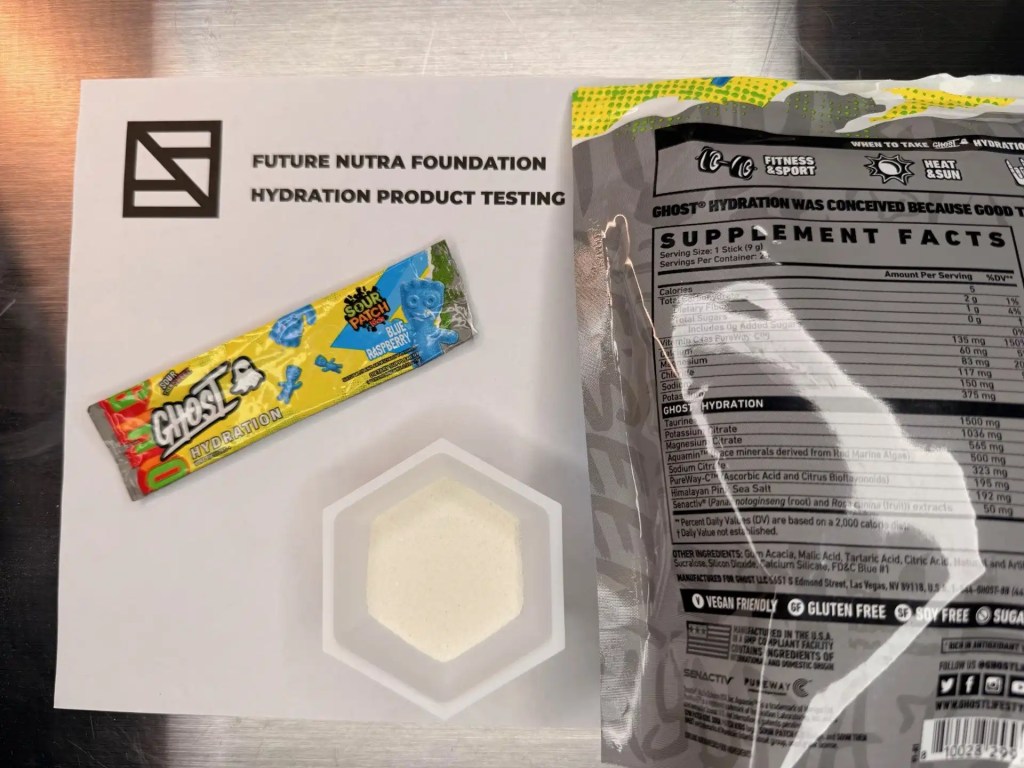
Ghost Electrolytes

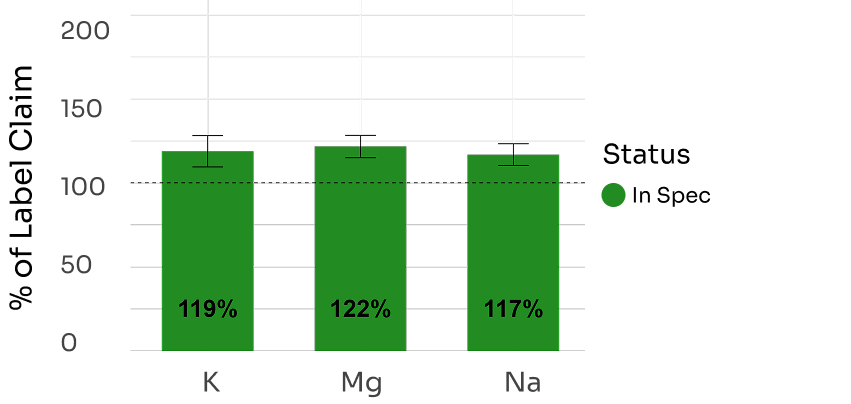
Both labs measured more sodium, magnesium and potassium than the label lists.

Lab measurements vs. label claims
Original laboratory comparison chart for Ghost ElectrolytesEnlarge chart ↗

100% = matches the label
K = potassium · Mg = magnesium · Na = sodium

What do the colors and error bars mean?

The colors carry the original report’s labels, such as “In Spec” and “Caution High.” The source report does not specify the numerical thresholds or how its error bars were calculated. These labels are not a separate safety rating. The chart is reproduced as published; its statistical basis is not specified in the accompanying text. The table shows each laboratory separately.

View both laboratories’ measurements

Laboratory results

Amounts per reported serving. Scroll for all columns ↔
Brand Labs Serving Size (g) Na (mg/serv) Mg (mg/serv) K (mg/serv) K % of Claim Mg % of Claim Na % of Claim Label Na Label Mg Label K
Brand: Ghost (Lot# No: 750433) Serving Size: 9 g
Ghost (Lot# No: 750433) Omnient Labs 9 168 105 421 112% 126% 112% 150 83 375
NJ Labs 9 182 97 470 125% 117% 121% 150 83 375
Avg (Labs) 9 175 101 445 119% 122% 117% 150 83 375
Read the detailed findings

Independent testing from Omnient Labs and NJ Labs shows that Ghost exceeds label claims across all measured electrolytes. Sodium levels tested at 112% in Omnient Labs and 121% in NJ Labs, averaging 117%. Magnesium also exceeded the label claim, with Omnient Labs reporting 126% and NJ Labs reporting 117%, averaging 122%. Potassium results were similarly elevated, with Omnient Labs reporting 112% and NJ Labs reporting 125%, averaging 119%. Overall, Ghost demonstrates strong consistency and remains well within specification across all tested electrolytes.

Dr. Berg Electrolytes

See the individual lab measurements and the original comparison chart below. The detailed findings are retained for reference.

Lab measurements vs. label claims
Original laboratory comparison chart for Dr. Berg ElectrolytesEnlarge chart ↗

100% = matches the label
K = potassium · Mg = magnesium · Na = sodium

What do the colors and error bars mean?

The colors carry the original report’s labels, such as “In Spec” and “Caution High.” The source report does not specify the numerical thresholds or how its error bars were calculated. These labels are not a separate safety rating. The chart is reproduced as published; its statistical basis is not specified in the accompanying text. The table shows each laboratory separately.

View both laboratories’ measurements

Laboratory results

Amounts per reported serving. Scroll for all columns ↔
Brand Labs Serving Size (g) Na (mg/serv) Mg (mg/serv) K (mg/serv) K % of Claim Mg % of Claim Na % of Claim Label Na Label Mg Label K
Brand: Dr. Berg (Lot# No: 24E0381) Serving Size: 6 g
Dr. Berg (Lot# No: 24E0381) Omnient Labs 6 40 223 1084 108% 186% 100% 40 120 1000
NJ Labs 6 46 147 1250 125% 122% 115% 40 120 1000
Avg (Labs) 6 43 185 1167 107% 154% 117% 40 120 1000
Read the detailed findings

The original written interpretation contains percentages that differ from the laboratory table. Both are retained as published; the discrepancy needs scientific review.

Independent testing shows that Dr. Berg’s electrolyte levels are generally close to the stated label claims. Potassium measures at 99% of the label claim, while magnesium is slightly higher at 111%, both remaining within acceptable ranges. Sodium comes in lower at 94% of the label claim and is flagged as caution low on the chart. Overall, results indicate modest variation from label values, with magnesium delivering more and sodium delivering slightly less than advertised.

Unmatched Electrolytes

Both labs measured more of all three minerals than the label lists, with the largest differences in potassium.

Lab measurements vs. label claims
Original laboratory comparison chart for Unmatched ElectrolytesEnlarge chart ↗

100% = matches the label
K = potassium · Mg = magnesium · Na = sodium

What do the colors and error bars mean?

The colors carry the original report’s labels, such as “In Spec” and “Caution High.” The source report does not specify the numerical thresholds or how its error bars were calculated. These labels are not a separate safety rating. The chart is reproduced as published; its statistical basis is not specified in the accompanying text. The table shows each laboratory separately.

View both laboratories’ measurements

Laboratory results

Amounts per reported serving. Scroll for all columns ↔
Brand Labs Serving Size (g) Na (mg/serv) Mg (mg/serv) K (mg/serv) K % of Claim Mg % of Claim Na % of Claim Label Na Label Mg Label K
Brand: Unmatched (Lot# No: 824099) Serving Size: 8 g
Unmatched (Lot# No: 824099) Omnient Labs 8 212. 145 390 130% 116% 106% 200 125 300
NJ Labs  8 203 143 358 119% 114% 101% 200 125 300
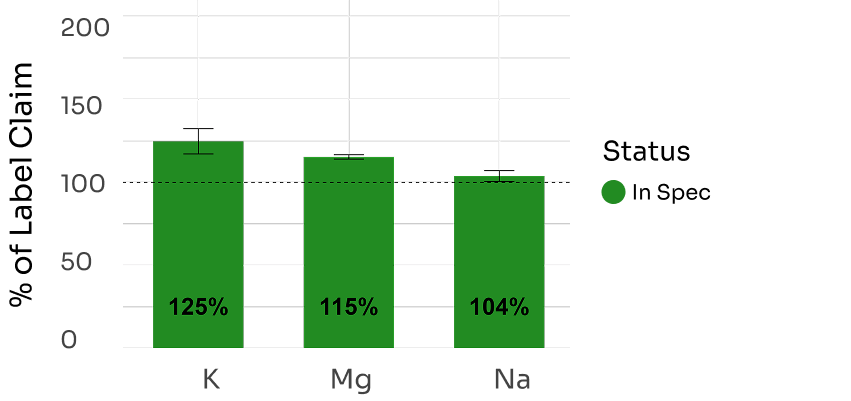
Avg (Labs)  8 208 144 374 125% 115% 104% 200 125 300
Read the detailed findings

The lab results for Unmatched show that sodium, magnesium, and potassium all exceed label claims. Omnient Labs reports potassium at 130.08% and magnesium at 116.22%, while NJ Labs confirms similar results with potassium at 119.33% and magnesium at 114.40%. Sodium levels, however, are slightly above the label at 106.08% and 101.50%, respectively. The product remains in spec, with potassium and magnesium values notably higher than expected.

AN Performance Electrolytes

Compare each lab’s measurements with the label values below. The detailed findings are retained for reference.

Lab measurements vs. label claims
Original laboratory comparison chart for AN Performance ElectrolytesEnlarge chart ↗

100% = matches the label
K = potassium · Mg = magnesium · Na = sodium

What do the colors and error bars mean?

The colors carry the original report’s labels, such as “In Spec” and “Caution High.” The source report does not specify the numerical thresholds or how its error bars were calculated. These labels are not a separate safety rating. The chart is reproduced as published; its statistical basis is not specified in the accompanying text. The table shows each laboratory separately.

View both laboratories’ measurements

Laboratory results

Amounts per reported serving. Scroll for all columns ↔
Brand Labs Serving Size (g) Na (mg/serv) Mg (mg/serv) K (mg/serv) K % of Claim Mg % of Claim Na % of Claim Label Na Label Mg Label K
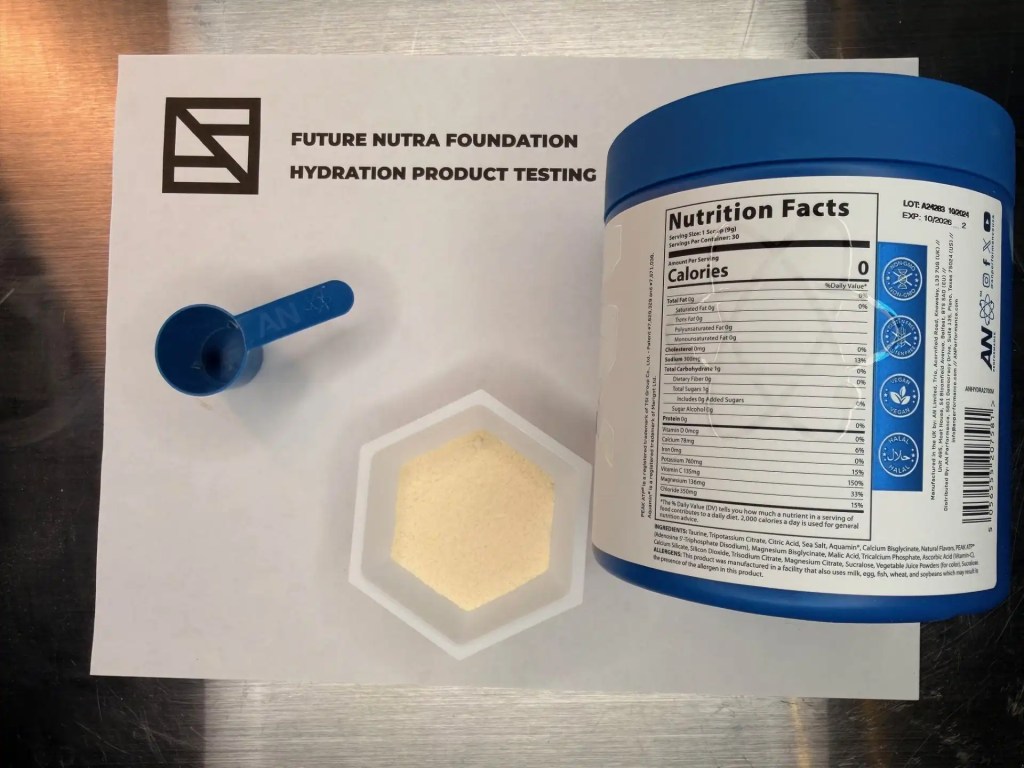
Brand: AN Performance (Lot# No: A24283) Serving Size: 9 g
AN Performance (Lot# No: A24283) Omnient Labs 9 302 100 705 93% 74% 101% 300 136 760
NJ Labs  9 334 105 761 100% 77% 111% 300 136 760
Avg (Labs)  9 318 102 733 96% 75% 106% 300 136 760
Read the detailed findings

The original written interpretation describes amounts below 100% as exceeding the label. The original wording and measurements are retained for scientific review.

Testing from Omnient Labs and NJ Labs shows that AN Performance exceeds the label claims for potassium (96%) and magnesium (75%). Sodium content is close to the label, with Omnient Labs reporting 93% and NJ Labs at 100%. Potassium and magnesium did not perform above expectations; however, the product remains within specification overall.

Pedialyte Sport Electrolytes

Sodium measurements differed between labs: one measured below the label claim and the other above it.

Lab measurements vs. label claims
Original laboratory comparison chart for Pedialyte Sport ElectrolytesEnlarge chart ↗

100% = matches the label
K = potassium · Mg = magnesium · Na = sodium

What do the colors and error bars mean?

The colors carry the original report’s labels, such as “In Spec” and “Caution High.” The source report does not specify the numerical thresholds or how its error bars were calculated. These labels are not a separate safety rating. The chart is reproduced as published; its statistical basis is not specified in the accompanying text. The table shows each laboratory separately.

View both laboratories’ measurements

Laboratory results

Amounts per reported serving. Scroll for all columns ↔
Brand Labs Serving Size (g) Na (mg/serv) Mg (mg/serv) K (mg/serv) K % of Claim Mg % of Claim Na % of Claim Label Na Label Mg Label K
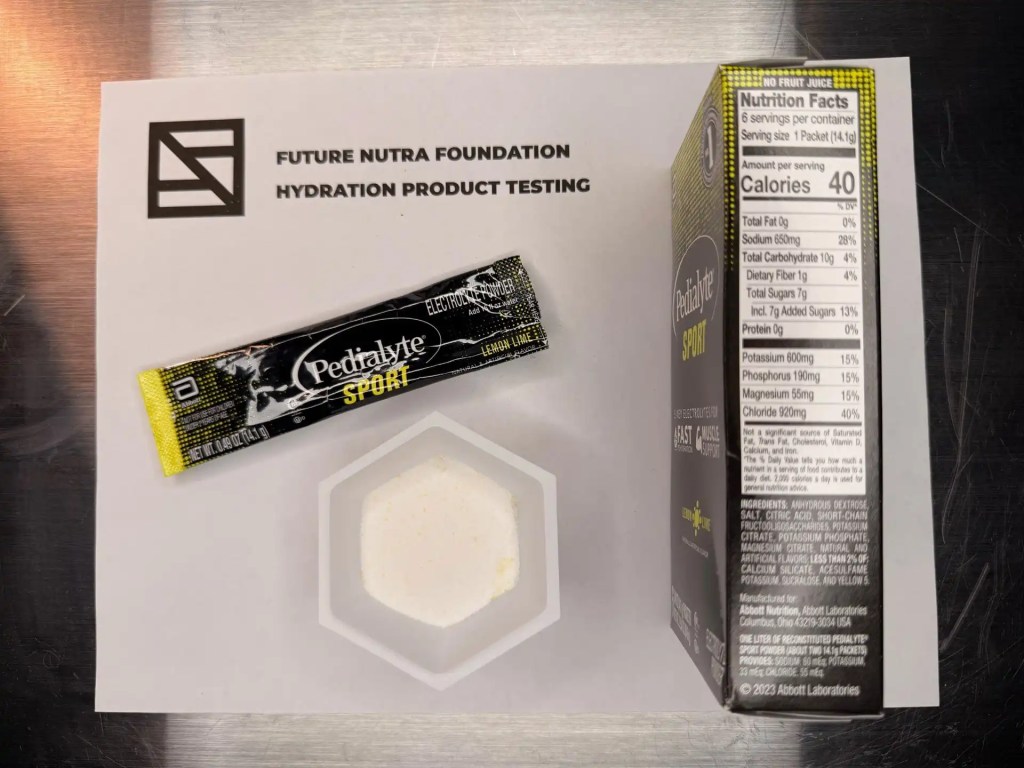
Brand: Pedialyte Sport (Lot# No: 697032S00) Serving Size: 14.1 g
Pedialyte Sport (Lot# No: 697032S00) Omnient Labs  14.1 589 78 670 112% 143% 91% 650 55 600
NJ Labs  14.1 887 61 723 120% 111% 136% 650 55 600
Avg (Labs)  14.1 738 70 697 116% 127% 114% 650 55 600
Read the detailed findings

Sodium results vary between the two laboratories, with Omnient Labs reporting slightly below the label claim at 91%, while NJ Labs reported a higher result at 136%. Although NJ Labs falls into a caution-high range, both results remain within acceptable specification limits.

DripDrop Electrolytes

Compare the sodium, magnesium and potassium measurements below. The detailed findings are retained for reference.

Lab measurements vs. label claims
Original laboratory comparison chart for DripDrop ElectrolytesEnlarge chart ↗

100% = matches the label
K = potassium · Mg = magnesium · Na = sodium

What do the colors and error bars mean?

The colors carry the original report’s labels, such as “In Spec” and “Caution High.” The source report does not specify the numerical thresholds or how its error bars were calculated. These labels are not a separate safety rating. The chart is reproduced as published; its statistical basis is not specified in the accompanying text. The table shows each laboratory separately.

View both laboratories’ measurements

Laboratory results

Amounts per reported serving. Scroll for all columns ↔
Brand Labs Serving Size (g) Na (mg/serv) Mg (mg/serv) K (mg/serv) K % of Claim Mg % of Claim Na % of Claim Label Na Label Mg Label K
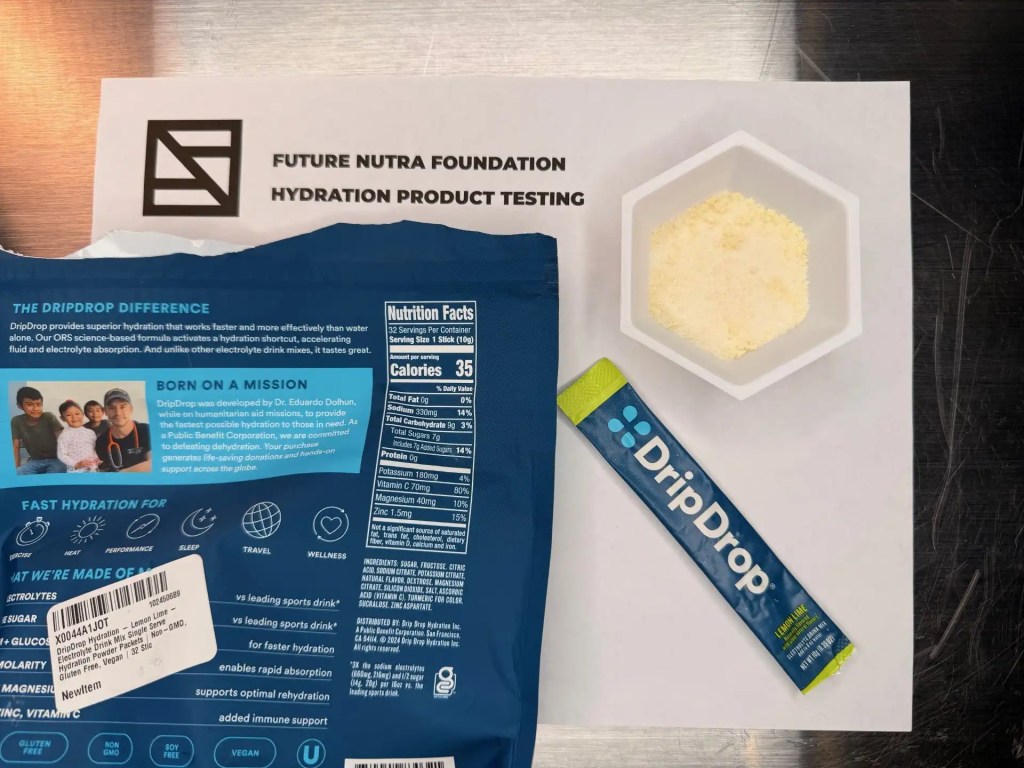
Brand: DripDrop (Lot# No: P49125) Serving Size: 10 g
DripDrop (Lot# No: P49125) Omnient Labs 10 318 44. 152 84% 111% 96% 330 40 180
NJ Labs  10 335 56 219 122% 140% 102% 330 40 180
Avg (Labs)  10 327 50 185 103% 125% 99% 330 40 180
Read the detailed findings

The original written interpretation names AN Performance within the DripDrop section. It is retained as published and needs scientific review.

Testing from Omnient Labs and NJ Labs shows that AN Performance meets the label claim for potassium (103%) and exceeds the label claim for magnesium (125%). Sodium results show variability, with Omnient Labs reporting 96% and NJ Labs reporting 102%. While magnesium performs above expectations, sodium falls slightly below specification, impacting the product’s overall compliance.

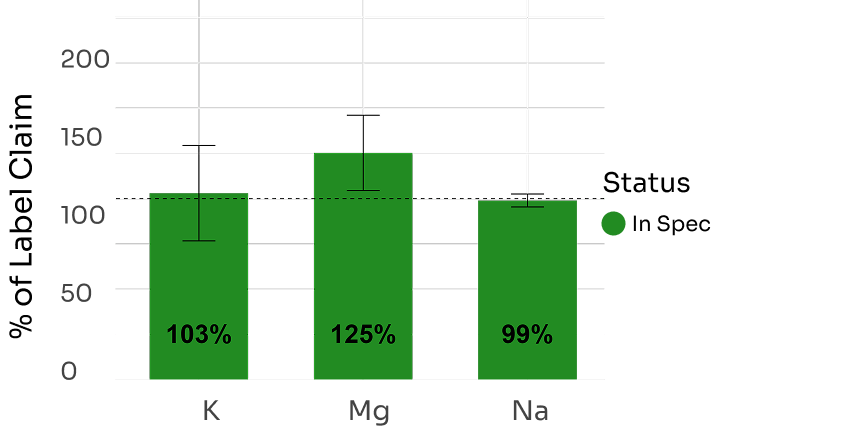
Liquid Death Electrolytes

Both labs measured sodium below the label claim and magnesium above it. Potassium results varied between labs.

Lab measurements vs. label claims
Original laboratory comparison chart for Liquid Death ElectrolytesEnlarge chart ↗

100% = matches the label
K = potassium · Mg = magnesium · Na = sodium

What do the colors and error bars mean?

The colors carry the original report’s labels, such as “In Spec” and “Caution High.” The source report does not specify the numerical thresholds or how its error bars were calculated. These labels are not a separate safety rating. The chart is reproduced as published; its statistical basis is not specified in the accompanying text. The table shows each laboratory separately.

View both laboratories’ measurements

Laboratory results

Amounts per reported serving. Scroll for all columns ↔
Brand Labs Serving Size (g) Na (mg/serv) Mg (mg/serv) K (mg/serv) K % of Claim Mg % of Claim Na % of Claim Label Na Label Mg Label K
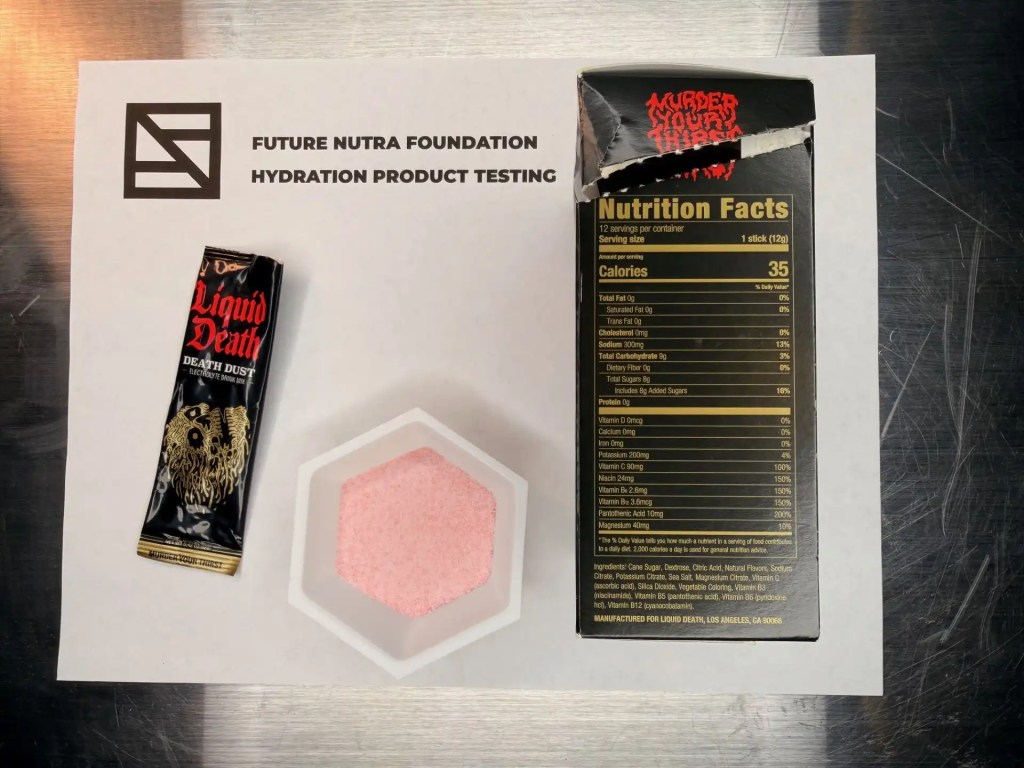
Brand: Liquid Death (Lot# No: 06224-3) Serving Size: 12 g
Liquid Death (Lot# No: 06224-3) Omnient Labs 12 276 45 186 93% 113% 92% 300 40 200
NJ Labs  12 286 44 210 105% 110% 95% 300 40 200
Avg (Labs)  12 281 45 198 99% 111% 94% 300 40 200
Read the detailed findings

Sodium levels in Liquid Death tested slightly below the label claim, with Omnient Labs reporting 92% and NJ Labs reporting 95%. Potassium results show some variability, with Omnient Labs slightly below the label at 93% and NJ Labs slightly above at 105%, averaging 99% overall. Magnesium consistently exceeds the label claim, averaging 111% across both labs. Overall, the product performs well for potassium and magnesium, while sodium falls slightly below specification.

Nutricost Electrolytes

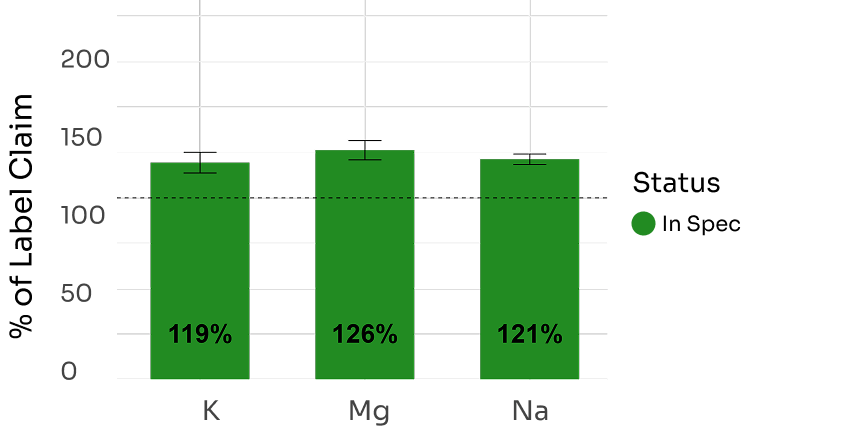
Both labs measured more sodium, magnesium and potassium than the label lists.

Lab measurements vs. label claims
Original laboratory comparison chart for Nutricost ElectrolytesEnlarge chart ↗

100% = matches the label
K = potassium · Mg = magnesium · Na = sodium

What do the colors and error bars mean?

The colors carry the original report’s labels, such as “In Spec” and “Caution High.” The source report does not specify the numerical thresholds or how its error bars were calculated. These labels are not a separate safety rating. The chart is reproduced as published; its statistical basis is not specified in the accompanying text. The table shows each laboratory separately.

View both laboratories’ measurements

Laboratory results

Amounts per reported serving. Scroll for all columns ↔
Brand Labs Serving Size (g) Na (mg/serv) Mg (mg/serv) K (mg/serv) K % of Claim Mg % of Claim Na % of Claim Label Na Label Mg Label K
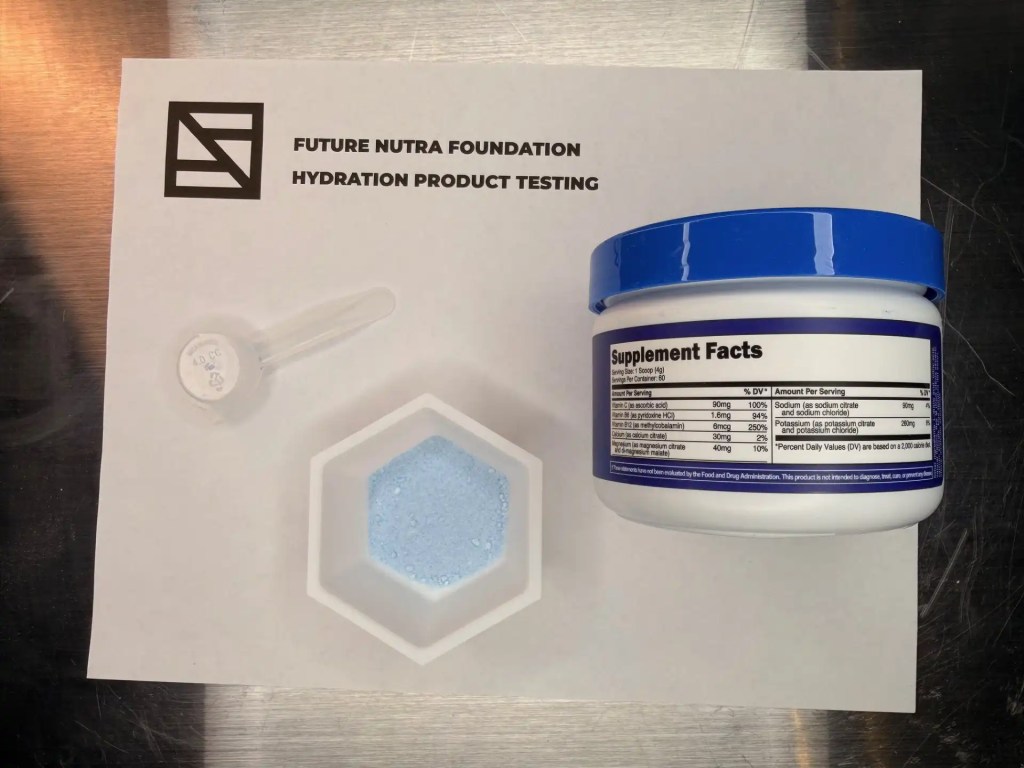
Brand: Nutricost (Lot# No: 24082872) Serving Size: 4 g
Nutricost (Lot# No: 24082872) Omnient Labs 4 107 52 300 115% 130.00% 119% 90 40 260
NJ Labs  4 111 49 321 123% 122.50% 123% 90 40 260
Avg (Labs)  4 109 50 310 119% 126% 121% 90 40 260
Read the detailed findings

Lab tests from Omnient Labs and NJ Labs confirm that Nutricost exceeds its label claims in all three electrolytes: sodium, potassium, and magnesium. Potassium reaches 119%, magnesium 126%, and sodium 121%, confirming the product’s consistency and in spec performance.

Compare two products

See the reported amounts side by side

Amounts are in milligrams per reported serving. Serving sizes differ; these values have not been adjusted or recalculated.

Methodology

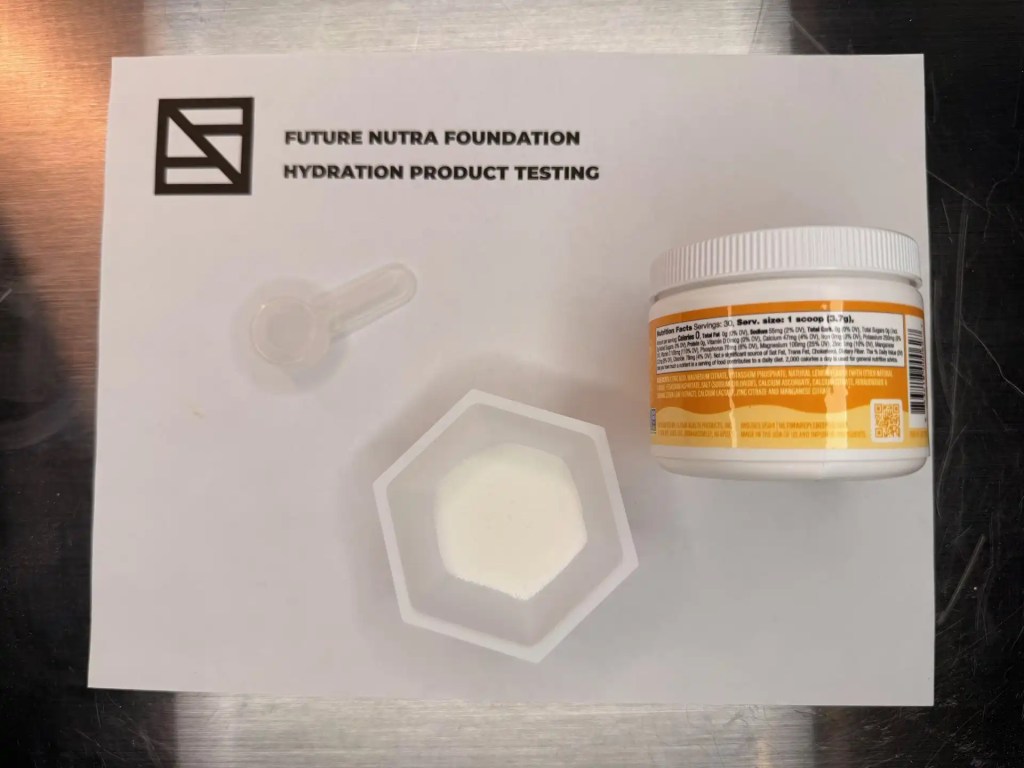
All products were independently purchased either through Amazon or directly from the manufacturer to reflect what consumers would receive in the marketplace. Samples were submitted to two independent ISO 17025–accredited laboratories: Omnient Labs and NJ Labs.
Mineral analysis was performed using Inductively Coupled Plasma–Mass Spectrometry (ICP-MS), a highly sensitive and validated analytical technique widely used for quantitative elemental analysis. Each product was tested in triplicate to ensure reproducibility and analytical reliability.
Samples were not blinded; however, laboratories did not communicate results prior to issuance of final reports, and all data were transmitted directly in formal laboratory documentation. No data manipulation or post-analysis adjustments were made beyond standard quality control verification procedures.

Future Nutra Foundation extends special thanks to Omnient Labs and NJ Labs for their generous contribution and technical support in making this analysis possible.

Scroll to Top